Floats, are, in a manner of speaking, elements that disrupt the text flow and are usually tables and figures. It is possible to define custom floats environments, but we’ll see that in an other article :)
Floats “swim” in the text, they position themselves where they have to in order to have a smooth read. This has a clear advantage in both consistency and beauty compared to dumb tables and dumb figures included without any movements allowed.
Strap on your seatbelt, you’re going to discover much fun stuff, but it’s rather complicated. Tables
Tables
Let’s start with tables. Before learning to create tables, we’ll need to learn how to create tabulars in order to fill up this environment, otherwise, it would have no interest. Let’s go! Basic tabulars
Basic tabulars
To create “basic” tabulars, we need the tabular environment to which we need to specify the number of columns by telling it how to align the text of the cell.
This is how to proceed:
\documentclass[paper=a4,
               fontsize=11pt,
               titlepage,
              ]{article}

\input{preambule}

\begin{document}

\begin{tabular}{cccc}
    Autmone & Hiver & Printemps & Été \\
    21 septembre -- 21 décembre & 21 décembre -- 21 mars & 21 mars -- 21 juin & 21 juin -- 21 septembre \\
\end{tabular}

\end{document}
This is what we obtain after compilation:

Result after compiling
A table representing the 4 seasons and their beginning and end date (in french).
We note the 4 “c”. They mean that I wish my text of each four column to be horizontally centered. Here are how to produce the different alignments:
- l to align left
- r to align right
- c to center
Now, you might wish to print out the separating lines of the cells of your tabular. No worries, it’s perfectly doable, just look at this code snippet:
\begin{tabular}{|c|c|c|c|}

\hline

Automne & Hiver & Printemps & Été \\

\hline

21 septembre -- 21 décembre & 21 décembre -- 21 mars & 21 mars -- 21 juin & 21 juin -- 21 septembre \\

\hline

\end{tabular}
Which gives this result:
Result of compiling code above
Result of compiling
Of course, you put as many pipes between the columns and as many \hline between the rows as you like.
Experiment until you find something that works for you.
You may wish to add this to your preamble.tex:
%-% Customise the separation rules of tabular lines
%-% Available: \toprule, \midrule, \bottomrule, \specialrule{2.5pt}{1pt}{1pt}

\usepackage{booktabs}\begin{tabular}{cccc}
\toprule
Automne & Hiver & Printemps & Été \\
\midrule
21 septembre -- 21 décembre & 21 décembre -- 21 mars & 21 mars -- 21 juin & 21 juin -- 21 septembre \\
\bottomrule
\end{tabular}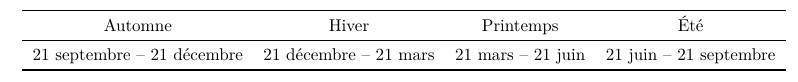
Result of compiling
A table with different line sizes between sections.
The table environment
Now that we know how to create tabulars, let’s make them floats for a bit more beauty. We’ll nedd to use the table environment, which wil allow us to make a table of tables, to put captions on them et to have references.
It’s actually quite easy, you just need to encapsulate your tabular into the environment, as shown below:
\begin{table}[h]
\centering
\caption{Table des saisons et de leurs dates}
\begin{tabular}{cccc}

\toprule

Automne & Hiver & Printemps & Été \\

\midrule

21 septembre -- 21 décembre & 21 décembre -- 21 mars & 21 mars -- 21 juin & 21 juin -- 21 septembre \\

\bottomrule

\end{tabular}
\label{tab:saisons}
\end{table}
As you can see in Table~\ref{tab-saisons}, I almost know my seasons!Compile! (twice)
We’ve discovered quite a few things at the same time. Let’s start by the beginning: we encapsulated the tabular in the table environment, with the [h] parameter, which means that we wish that the table is placed roughly there. Here is the list of the parameters available:
- h, puits the float where it appears in the text
- t, puts the float at the top of the page
- b, puts the float at the bottom of the page
- p, puts the float on a page dedicated to floats.
Be warned that floats do float around, and are going to take a stroll inside your document, where LaTeX deems appropriate, to save up space. Stop tearing your hair out and just roll with it.
We also discovered the \centering command that allows us to center the tabular inside the table environment. The \caption command allozs us to add a caption to the float, as well as the \label command that creates a reference that we can use later on, in the text to cross-reference it with the \ref command.
In order to display correctly the references, you need to compile twice, like with the table of content.
You should have noticed that the Table is numbered: the numbers are automatically attributed following the order of appearance in the source code. You don’t need to give a number to the Table, LaTeX does that for you \o/.
Tabulars: multicolumn and multirow
Since we know how to create pretty tables, it’s time to learn a bit more about tabulars, because we’ve just scratched the surface.
Here’s the code required to do multicolumn:
\begin{table}[h]

 \centering

 \caption{Table des noms de mutations de patients imaginaires}

 \begin{tabular}{cccc}

 \toprule

 Patient 1 & Patient 2 & Patient 3 & Patient 4 \\

 \midrule

 \multicolumn{2}{c}{Mutation 1} & Mutation 2 & Mutation 3 \\

 \bottomrule

 \end{tabular}

 \label{tab:patients}

\end{table}


Comme vous pouvez le voir Table~\ref{tab-patients}, …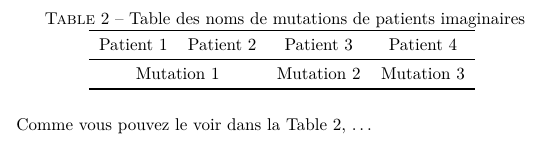
Result of compiling code above
A table with multicolumn
If you wish to do mulirow, it’s a bit more complex, but it’s do-able. Before anything else, you need to add something to the preamble:
%-% Pour les tables, faire du multi-ligne
%-% \multirow{"num_rows"}{*}{"content"}
\usepackage{multirow}

And here's a practical example:

\begin{table}[h]

 \centering

 \caption{Table des gènes imaginaires}

 \begin{tabular}{|c|c|c|c|c}

 \hline

 Patient & Gène 1 & Gène 2 & Gène 3 \\

 \hline

 Foo & \multirow{2}{*}{Mutation 1} & Mutation 2 & Mutation 3 \\

 \cline{1-1} \cline{3-4}

 Bar & & Mutation 4 & Mutation 5 \\

 \hline

 \end{tabular}

 \label{tab:genes}

\end{table}
And you can see it gives you:
A table with multirow
Result of compiling above code
You sure have noticed the use of multirow and cline that stops the lines to intersect with the multirow cell.
Cell’s height
I don’t know what’s your opinion on this, but I find the default cell’s height completely horrible, the text inside the cells is packed, in a nutshell I don’t like it. I have a quick command to add to your preamble that improves this:
%-% Increasing the row's height
\usepackage{array}
\setlength{\extrarowheight}{3pt}
Obviously, you can play with the size I put (it’s the one that suits, me, it’s not universal) :)
Customize the caption
I was taught in biology that tables are supposed to be caption above the tabular and not below, so here’s how to do that.
%-% Pour customize captions in figures and tables
%-% /!\ Warning : \usepackage[labelsep=colon]{caption}
%-% Configuration is done below and will be taken into account in \caption{}
%-% http://www.lce.esalq.usp.br/clarice/Caption.pdf
\captionsetup[table]{format=hang, labelformat=simple, singlelinecheck=true, font=small, position=above}
You’ve noticed I put other parameters inside the configuration, because I like those. You can see what they do in the documentation of the package, so you can customize a bit more to your liking.
Creating tabulars with a specific length with tabularx
Another tabular environment quite useful exists: tabularx. It allows you to modify the length of the columns, to adapt those to the required length of your tabular. Not clear? Here’s an example:
\begin{table}
    \centering
    \begin{tabularx}{\textwidth}{|c|c|X|c|}
        \hline
        A & B & CD & EFGHIJKL \\
        \hline plop & plip & Là je peux écrire plein de choses car la largeur de la colonne dépendra de la largeur de la table et c'est
_        beaucoup trop cool & j'ai perdu \\
        \hline
    \end{tabularx}
    \label{tab:useless}
\end{table}
\lipsum
It doesn’t work? Well, that’s perfectly normal! You need to add something to your preamble! (Of course you do, you thought it was gonna work out of the box? Haven’t I tought you anything? :D)
%-% The tabularx environment allows to specify X. Columns using this specifier
%-% will be streched so that the tabular has the required length \o/
%-% \begin{tabularx}{\textwidth}{ |X|X|X|X| }
%-% \end{tabularx}
\usepackage{tabularx}
Which gives:
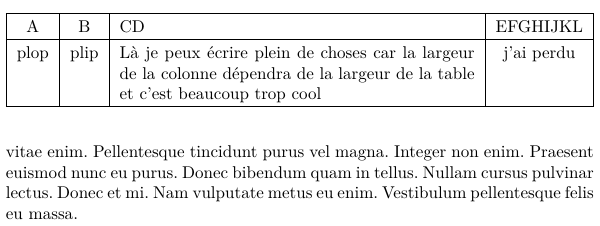
Please note the X’s effect that allows you to create the table as you like. \textwidth is the width I want: the text’s one but I you wish so, you can very well write 300pt!
There are still hundreds of things one can do with tabulars, but I’ve got a feeling you’re kind of bored (and me too :o) so let’s jump to another type of float: figures, i.e. the pictures.
The figures
As always in LaTeX, to do something specific, you need to add a \usepackage in the preamble. And that’s we’re gonna do to deal properly with pictures in LaTeX:
%-% To play with pictures
\usepackage{graphicx}
Insert a picture in a text
To do that, you just need to use the \includegraphics command as follow (we suppose that the picture is in a Images directory, directory located at the same depth as your source code):
\includegraphics[width=0.5\textwidth]{Images/youjustlost.jpg}
\lipsum- width, to deal with the picture’s width, here in function of the text’s width
- height, to deal with the picture’s height (for instance 500pt…)
- scale, to deal with the picture’s scale (for instance scale=0.5)
Here, the picture is stored in the Images directory. If you’re tired of telling to \includegraphics to go look in the Images directory (by default, it looks in the directory where the .tex is located) you can put the following command in your preamble:
\graphicspath{ {./Images/}{/home/maria/Blog/LaTeX/Images/} }Of course, replace the paths given with the one you need, and the final / is required.
With this command, you can add jpegs, pngs, and PDFs.
This has the following result:
You’ve juste lost and you can see what a includegraphics does.
Result of compiling code above
Now that you know how to include a picture, let’s make it float.
The figure environment
Just as we did with tabulars, we’re going to encapsulate the picture in an environment called figure.
You just need to type:
\begin{figure}[h]
    \centering
    \includegraphics[scale=1]{youjustlost.jpg}
    \caption{Vous avez tous perdu.}
    \label{fig:lost}
\end{figure}
Here we tell to the figure to place itself here with [h], like we did with the table environment. As a reminder:
- h places the float where it appears in the text
- t places the float at the top of the page
- b places the float at the bottom of the page
- p places the float on a dedicated page
We tell the figure to center itself using the \centering command. We make it captioned thanks to the \caption{} command. Finally, we add a label with the \label{} command, in order to be able to make references to it.
This gives:
A figure centered in the environment with a proper caption
Result of compiling code above
Just like tables, figures are automatically numbered following the order inside the document, no need to pester yourself numbering them by hand! It will come in handy for the table of figures.
Customize caption
Just like tables, figures' captions can be customized, using the caption package (that is already in your preamble if everything went smoothly ^^):
\captionsetup[figure]{format=hang, labelformat=simple, singlelinecheck=true, font=small}What about sub-figures?
To be honest, if it wasn’t possible to create sub-figures, LaTeX wouldn’t be of much use. Thankfully, it’s possible if you load the proper package in your premble:
%-% To do pretty subfigures
%-% \begin{subfigure} … \end{subfigure}
\usepackage{subcaption}
And now, let’s dive into the code:
\begin{figure}[h]
    \centering
    \begin{subfigure}[b]{0.45\linewidth}
        \centering
        \includegraphics[scale=1]{youjustlost.jpg}
        \caption{Une première fois…}
    \end{subfigure}%
    \hfill
    \begin{subfigure}[b]{0.45\linewidth}
        \centering
        \includegraphics[scale=1]{youjustlost.jpg}
        \caption{et une deuxième fois}
    \end{subfigure}
    \vspace{5pt}
    \begin{subfigure}[b]{0.45\linewidth}
        \centering
        \includegraphics[scale=1]{youjustlost.jpg}
        \caption{et une troisième fois…}
     \end{subfigure}%
     \hfill
     \begin{subfigure}[b]{0.45\linewidth}
        \centering
        \includegraphics[scale=1]{youjustlost.jpg}
        \caption{et une quatrième (dernière ?) fois}
     \end{subfigure}
     \caption{Vous avez tous perdu.}
     \label{fig:lost}
\end{figure}
And here we go:
A figure with four subfigures, each of them with a subcaption.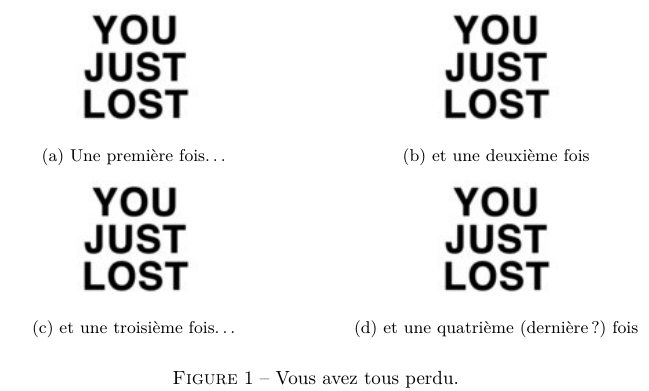
Result of compiling code above
Isn’t LaTeX wonderful?
Things about floats
Placing floats
So, basically, they go where they want, even though you specify the option [h]. You can try to impose your will a bit more with the [H] option, that is hidden in another package:
\usepackage{floats}But it’s not necessarily a goodidea…
If you think that your floats are swimming a bit too much, you can use the following trick:
%-% In order to use \FloatBarrier so that the floats stay in their section
\usepackage[section]{placeins}
More floats
If you ever find yourself in a situation where it tells you there are too many unprocessed floats during compilation, I suggest you use:
%-% To have moare floats
\usepackage[maxfloats=100]{morefloats}
Lists of tables and figures
As I promised at the beginning of the text, here’s how to make a list of tables:
\listoftablesTo put wherever you like in your document.
And for the figures, it’s sooooooooo hard to guess:
\listoffiguresLikewise, to put wherever you like in your document!
I think it’s quite enough for one time, so we’re gonna stop here. We’ll get back to it soon!