So? Have you heard about tikzit? No! Wonderful, I get to tell you a bit about it :)
To quote tikzit’s webpage:
TikZiT is a super simple GUI editor for graphs and string diagrams. Its native file format is a subset of PGF/TikZ, which means TikZiT files can be included directly in papers typeset using LaTeX. Pre-built versions are available for systems running Windows, Linux, or macOS.
As much as I like TikZ and use it directly, sometimes, I do use tikzit because, it’s much easier and quicker. For instance, it took me a few minutes to create:
An image of a molecule created using tikzit
RNA backbone with diedral angles
and figuring out the angles by hand inside a TikZ environment would have taken me much longer.
In this article I will try to convince you that tikzit is awesome by creating a mindmap. Why? Because I did recommand tikzit to Maiwann for this purpose and found the software hard to get a grisp on. So Maiwann, I hope I’ll make it a bit more clear.
Creating a node and a path
Once the software installed, launch it. You’ll get a minimal but convenient GUI that looks like that:
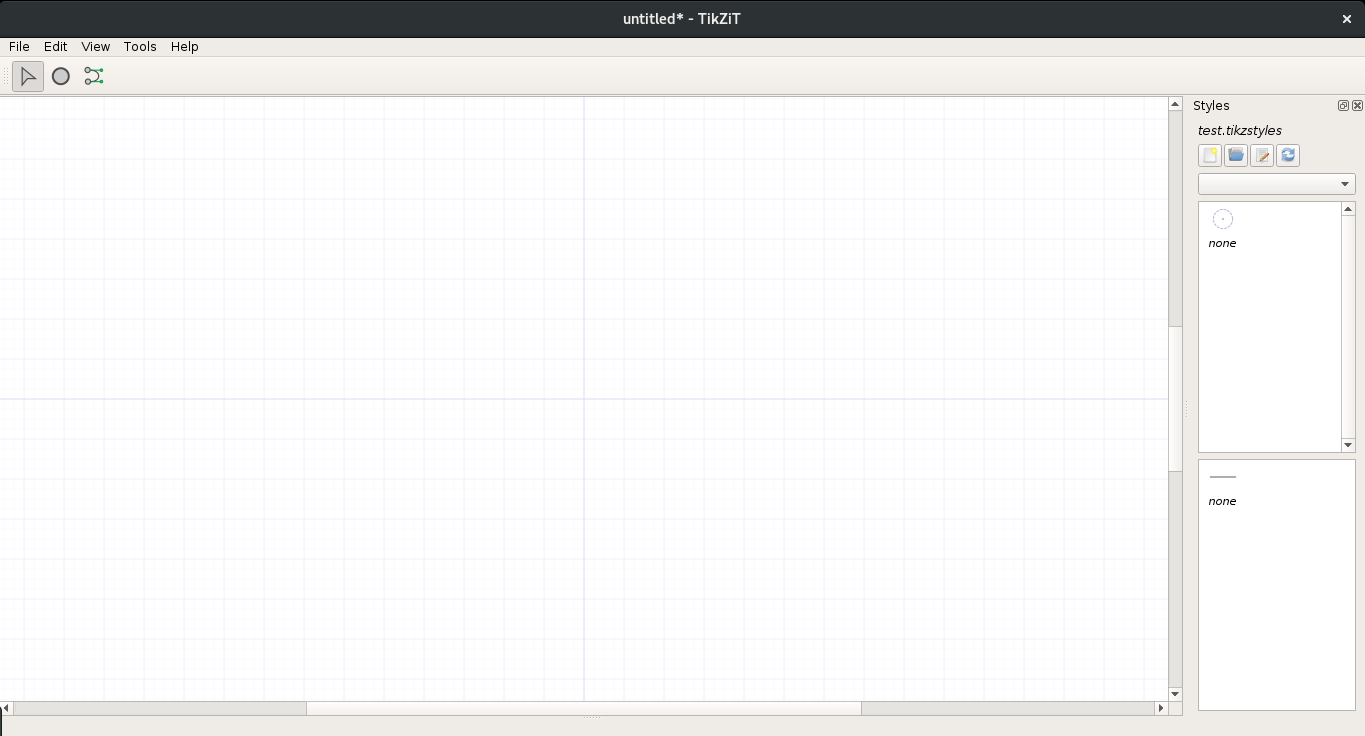
TikZit GUI
The arrow will allow you to select items. The circle represents a new node and the two circles linked by a path, a new edge.
The large rectangle is your play area. You can zoom in (ctrl +) or zoom out (ctrl -) and next to it, you find the style editor.
Select the node creator button (by clicking or using n) and then create, by clicking, two nodes in the play area. The nodes you just created are invisible nodes. They won’t appear in the output but are quite useful.
Select the edge creator button (by clicking or using e) and then draw an edge by dragging your mouse from a node to another.
Bending the edge
You should have something like that:
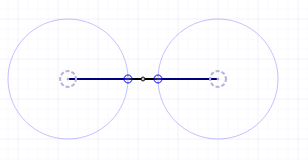
TikZit GUI
Two nodes linked by an edge with a curve editor
Select the select tool again, and play with the bend-modes:
- the basic one (blue) that allows control of the bending by one or the other end
- the bezier bend (green, two clicks) that allows control of the bending by the two ends independently
Labels
You can move your nodes around using the select tool (s) and label them by double-clicking on them.
You could get something like that:
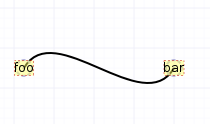
TikZit GUI
A node foo linked to a node bar by a curve
Let’s style this up
In order to create non-invisible nodes, we need to create styles, and first of all a style file.
In the style part of the screen, click on the new file icon and create a file called for instance “test.tikzstyles”.
We can now edit the styles by clicking on the edit button. We get something like that:
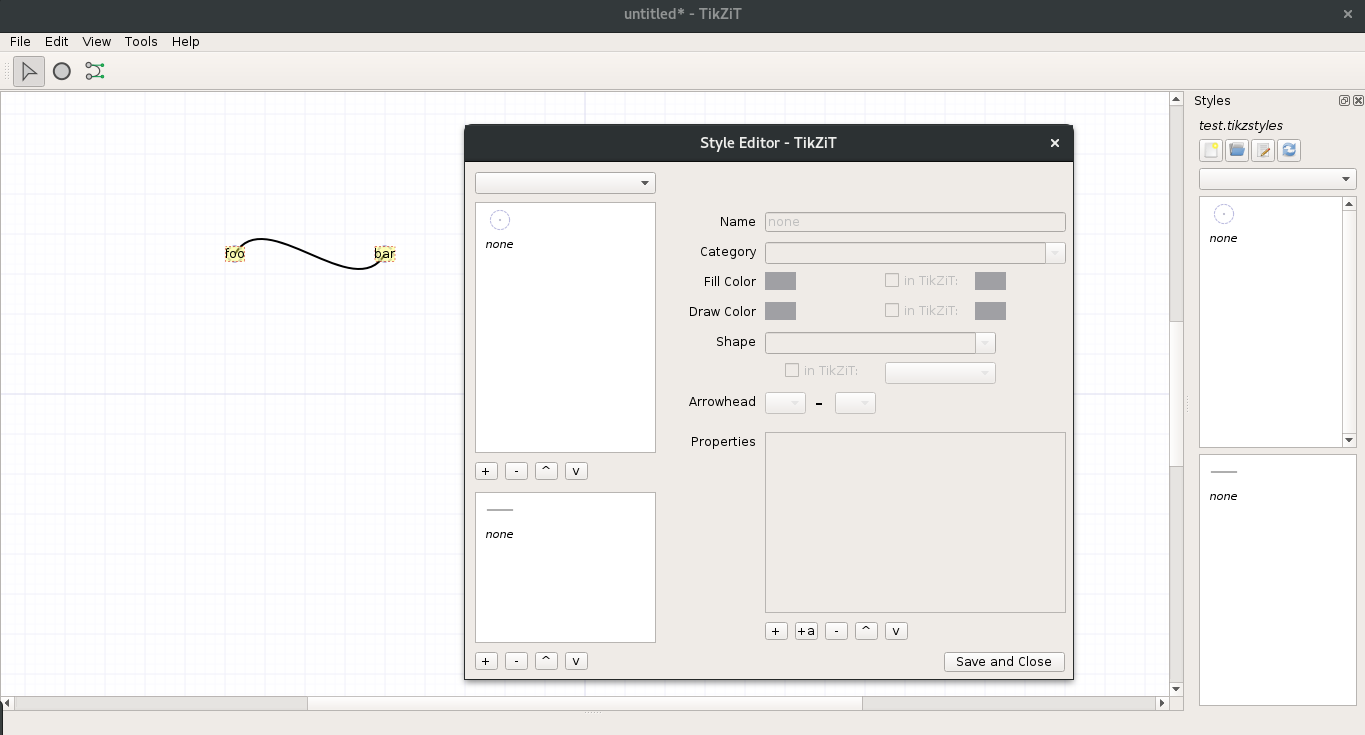
TikZit GUI
A simple style editor
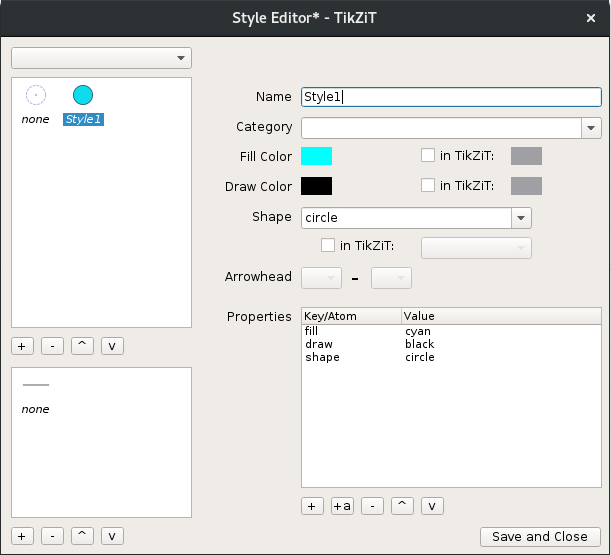
By clicking on the + button, create a new style and customize it. For instance, you could have:
TikZit GUI
A style called Style1: Circle, Fill color cyan, Draw color black
Save & close.
You can apply the style to a node by selecting the node and double-clicking on the required style. The same applies to edge styles.
Previewing and saving the image
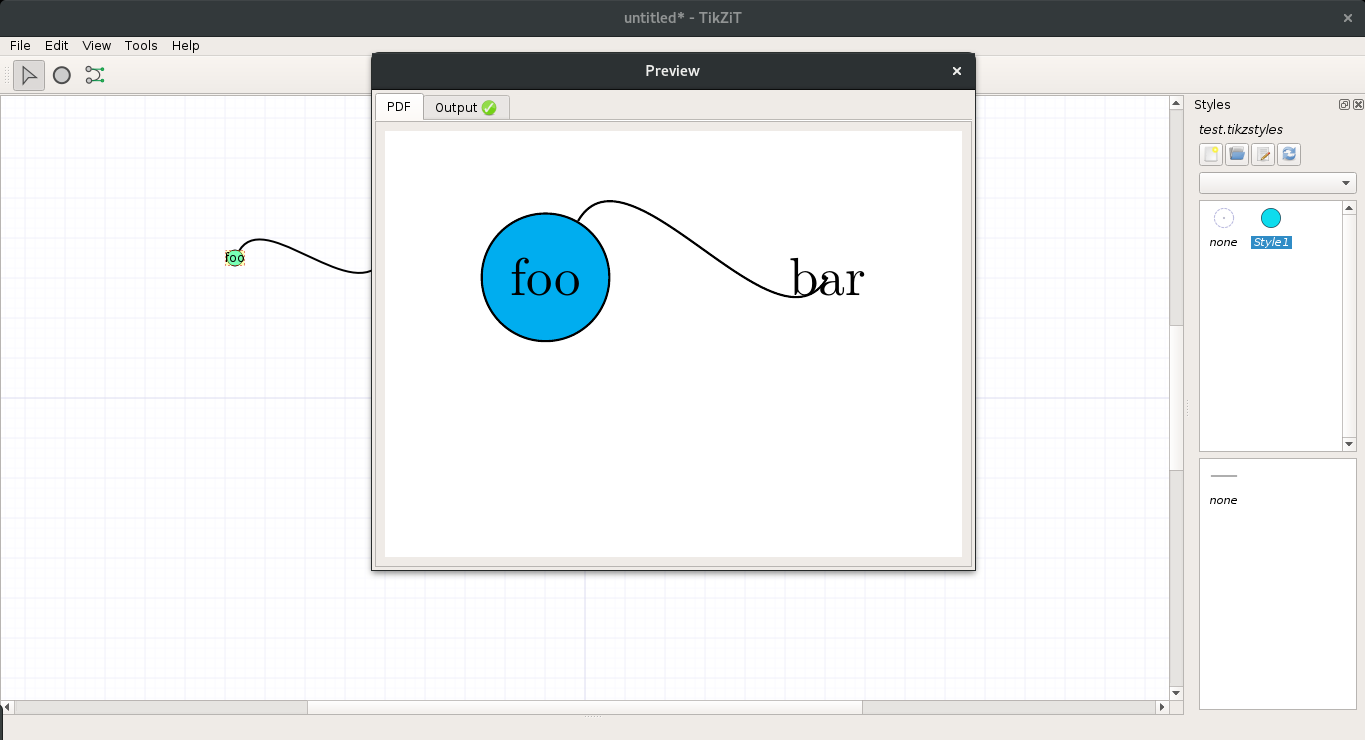
Hit ctrl r to get the preview of your diagram. You should get something like that:
TikZit GUI
A cyan round node foo linked by a curve to an invisible node bar
You can export the preview to png/jpeg/pdf by right-clicking inside the preview area.
Merging nodes (and creating symmetric figures)
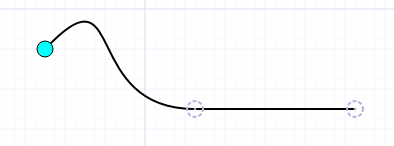
Design something like this with 3 nodes:
TikZit GUI
A curve with one cyan node and two invisible nodes
Imagine you want to have the symmetric of the curvy part:
- select the area of the curve
- copy/paste it
- hit alt and down-arrow
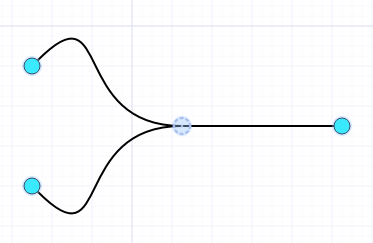
Drag the duplicate to the junction and hit ctrl and m. You’ll get a single node.
TikZit GUI
A symmetric figure thanks to the previous manipulations
And now you know everything there is to know to draw your own mindmap! For example, it took me a few minutes to generate this:
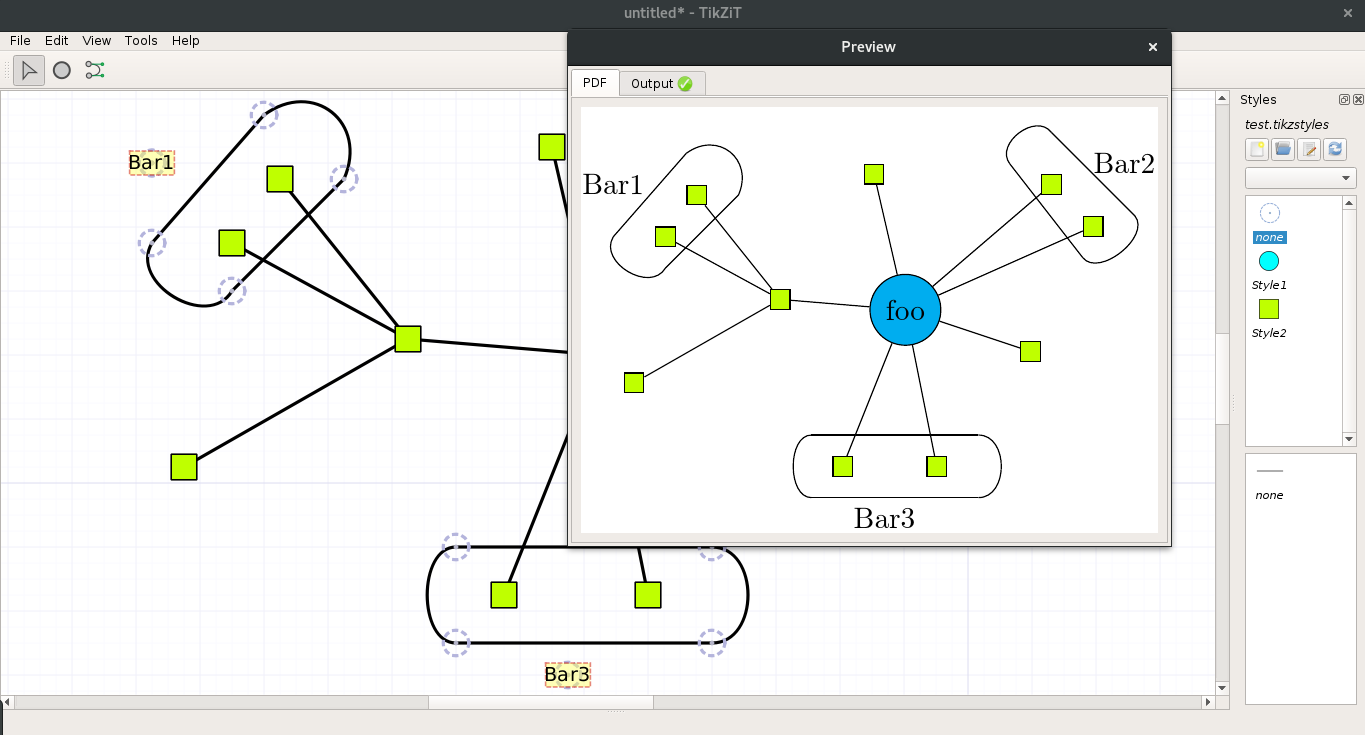
TikZit GUI
A preview with a mindmap on top of tikzit’s editor
More fancy stuff
Editing the TikZ source
Select a node/an edge and hit ctrl and j. An editor appears:
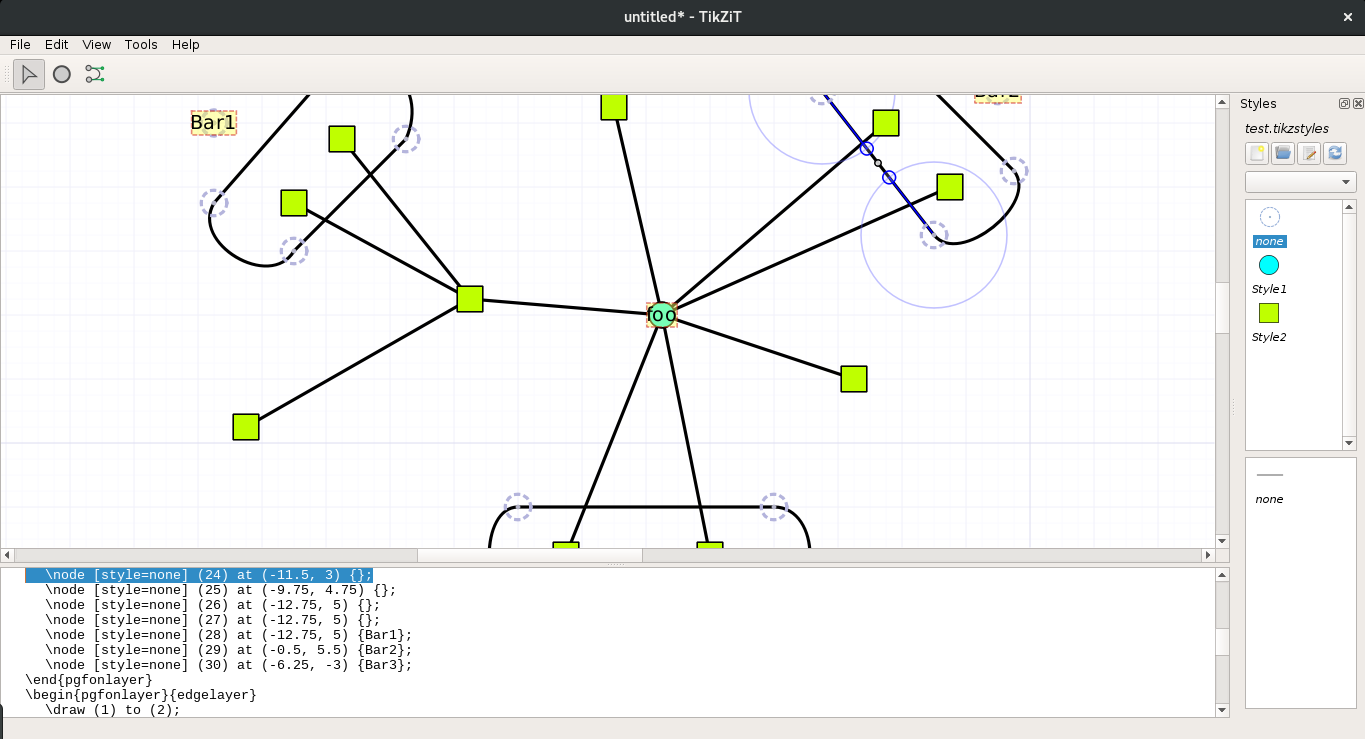
TikZit GUI
A tikzit window with an editor and LaTeX code
You can modify the source code there. Keep in mind that only a subset of TikZ is implemented in tikzit.
Modifying the position of text labels
You can modify the position of text labels using the TikZ editor and by adding a label property, for instance: label={above:plop}.
Integrating into LaTeX documents
You need to save your figure as “figure.tikz” for instance. Then, here’s a minimal working example of a LaTeX source code:
\documentclass{article}
\usepackage{tikzit}

\input{test.tikzstyles}

\begin{document}

A tikz figure:
\tikzfig{figure}

A centered tikz figure:
\ctikzfig{figure}

\end{document}
Adding custom LaTeX code to previews
Just create a “test.tizkdefs” in the same directory as the “test.tikzstyles” and define your commands.
Tikzit will automatically load it and use it.
If you wish to use the figure in a LaTeX file, please do the following:
\documentclass{article}
\usepackage{tikzit}

\input{test.tikzstyles}
\input{test.tikzdefs}

\begin{document}

\ctikzfig{figure}

\end{document}
Adding new properties to style
Open the style editor and click on one node style for instance. Then click on the + at the bottom of the editor. You can double click on the new property to modify it, for example by typing “minimum height”.
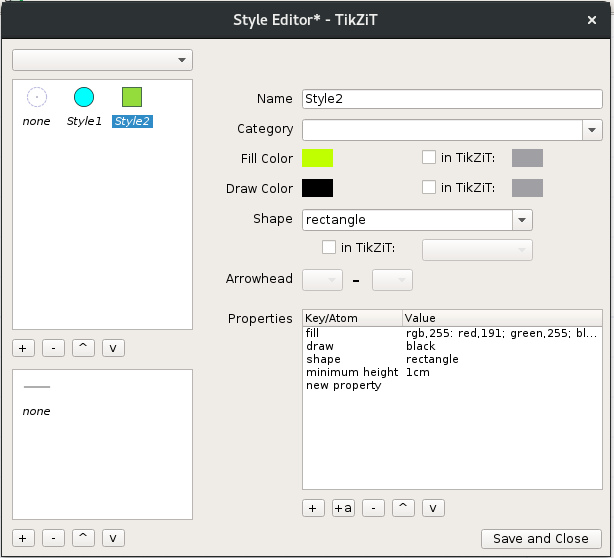
TikZit GUI
Adding a new property
Define the rectangle to your wished dimensions. You can then do something like this: an electric circuit
And I guess that’s it :)